← Home Welcome About Now Photos Archive Encyclosphere Tweets Also on Micro.blog
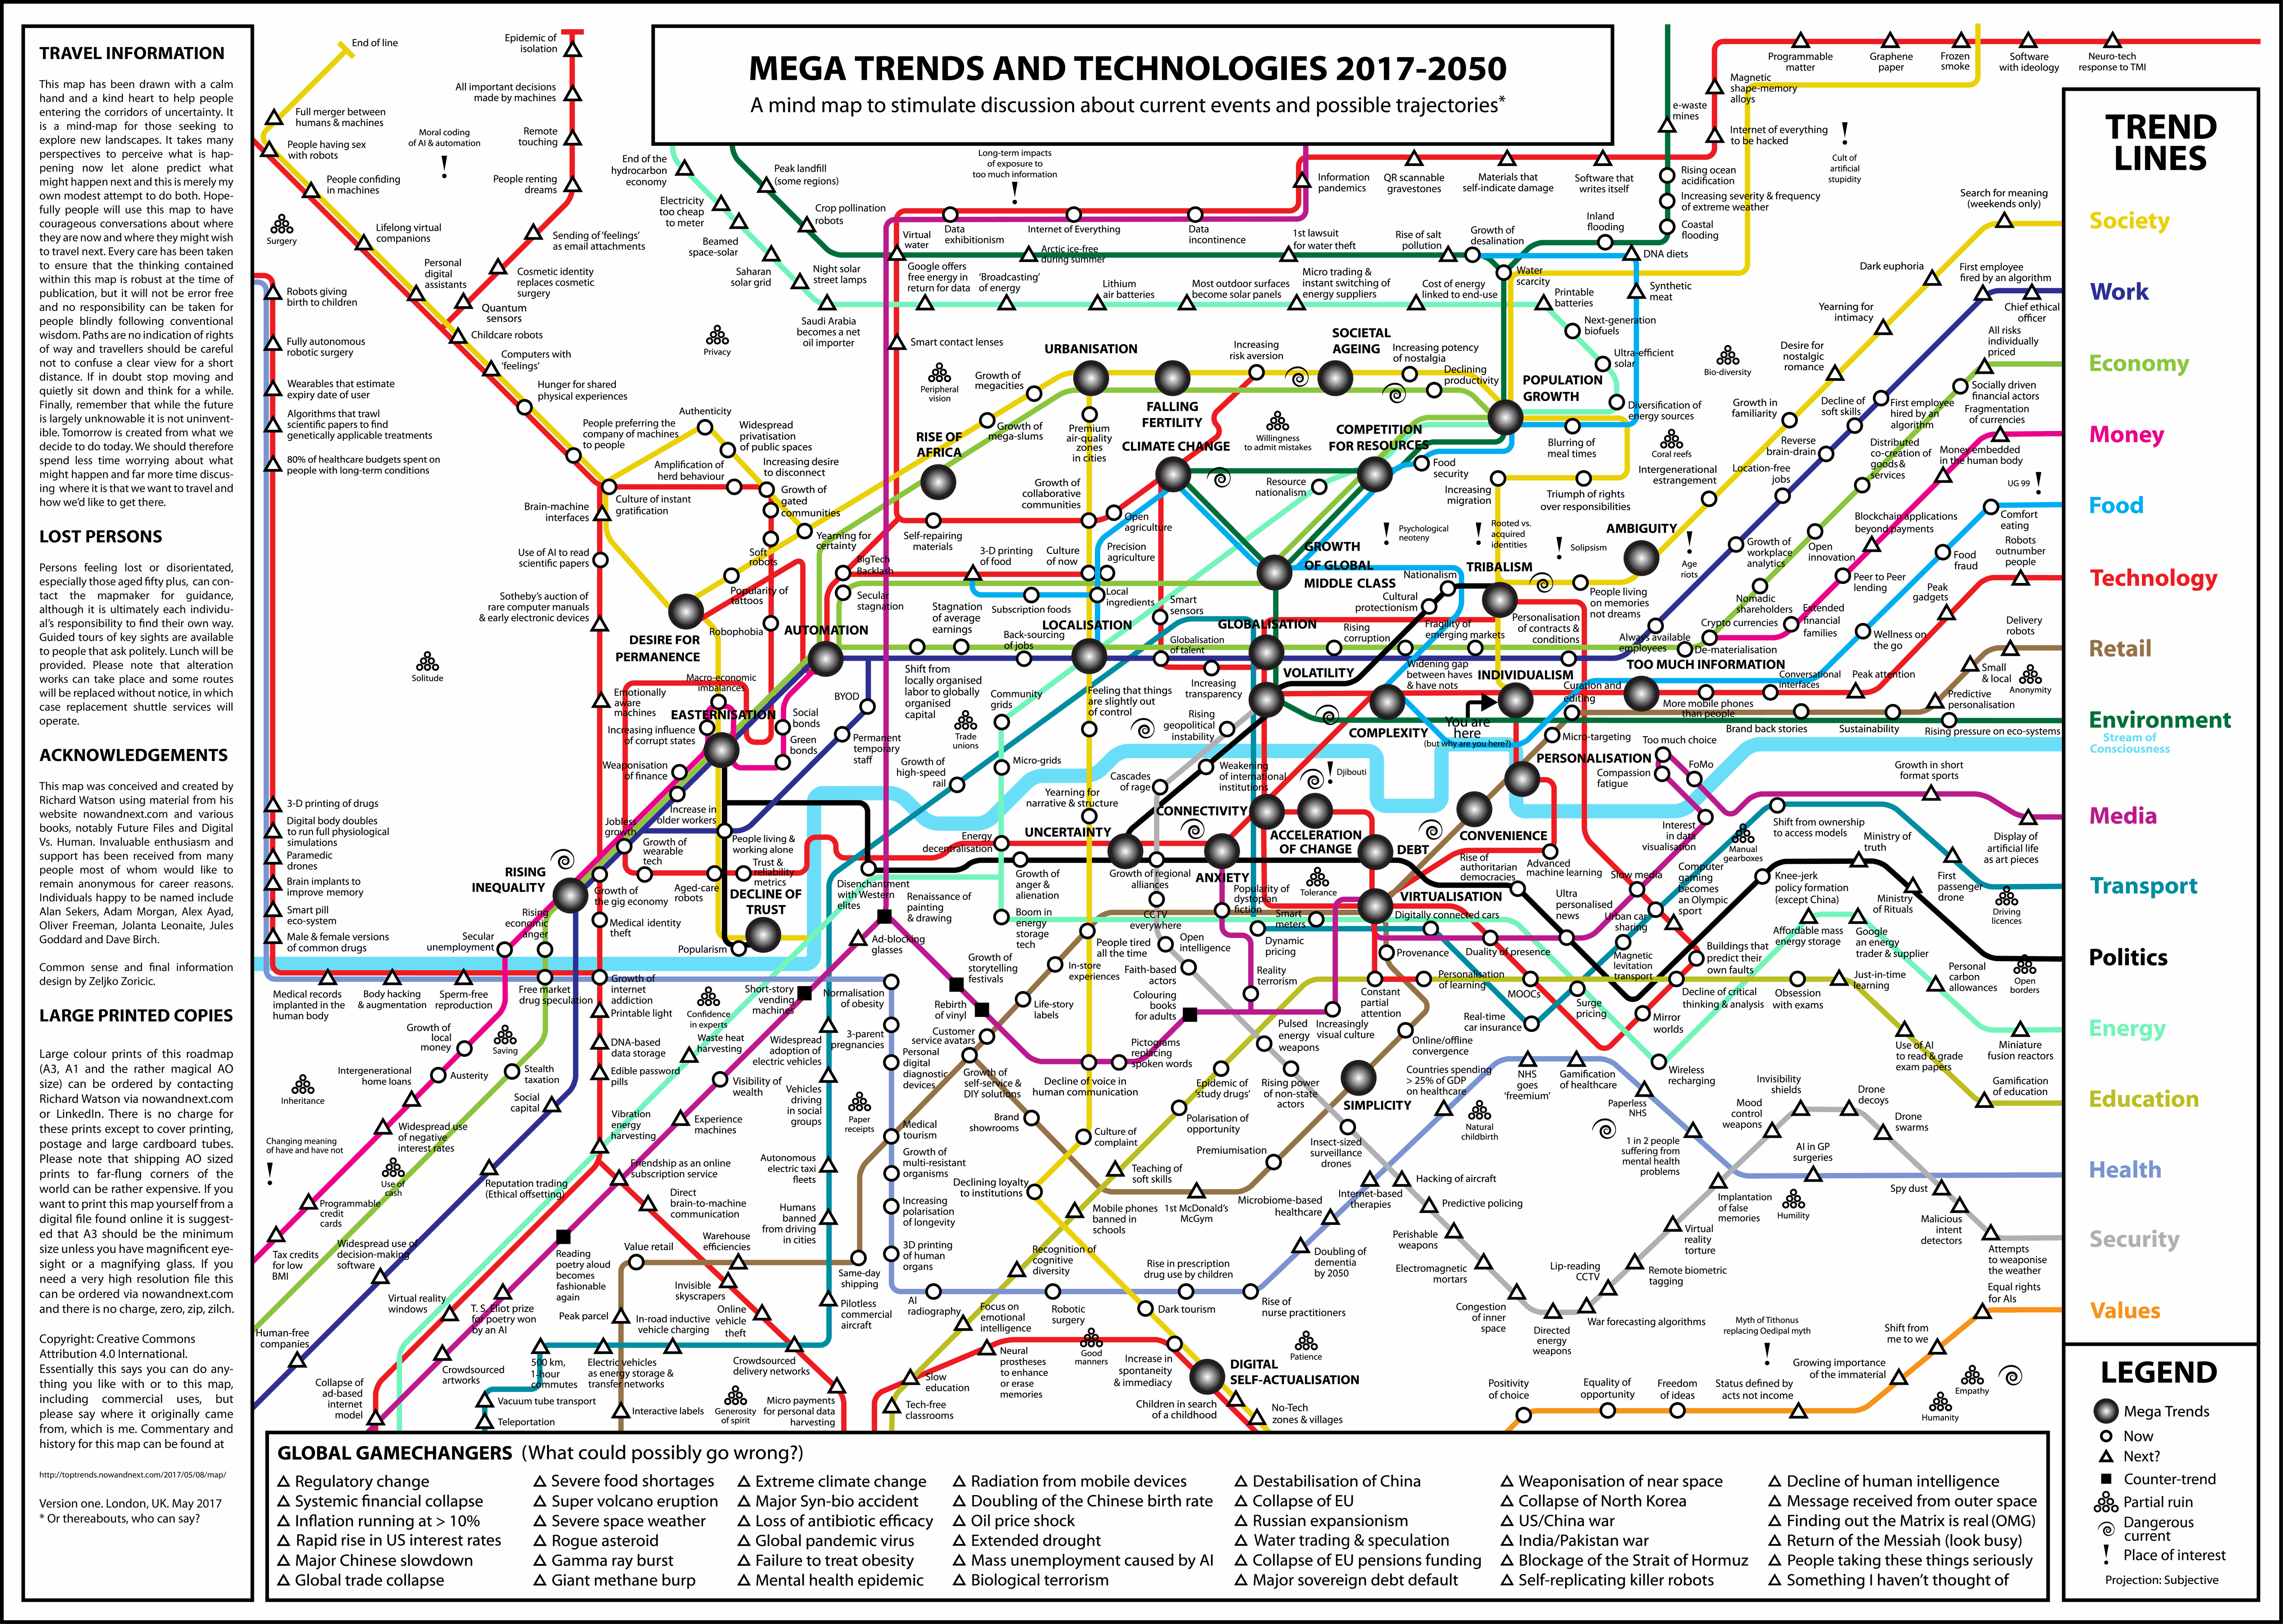
  • 2017 Mega Trends & Technologies map

    As envisioned and visualized in subway-map style by Richard Watson. Much to study in this infographic. Follow the trend lines for society, work, the economy, money, food, technology, retail, the environment, media, transportation, politics, energy, education, health, security, and values.

    Source: toptrends.nowandnext.com/2017/05/08/map/, and here’s a short link to it: j.mp/2EmXgqC.

    → 10:00 PM, Feb 28
  • Earth Temperature Timeline, Explained

    XKCD #1732: Earth Temperature Timeline. And a hat tip to the explain xkcd wiki. This is a big chart, and I, for one, appreciate that the crowd has developed an explanation. Read it.

    The topic of this post is infographics, not climate change, but while we’re on that subject I’ll admit I have at least two climate change deniers in my family. I’m to the left of them. But I also roll my eyes at those at the opposite end of the extreme scale of reactions to climate change. I’ll lament the demise of Climate Debate Daily. I guess it’s been a few years since I visited it. Three Christmas Eves ago, The hosts announced they were closing down the site. (It will live on at archive.org.) They sought “the strongest and most persuasive essays and articles supporting both sides of the debate.” But they closed on a pessimistic note. “Has the website been a success? It is hard to be sure, but our impression, based on reader feedback, is that it hasn’t. Few, if any, minds have been changed, in either direction. Confirmation bias is a powerful force, and we think that many people – no matter what their beliefs – simply read what they agree with and ignore or dismiss what they don’t. For the record, none of the three editors of the website have been in the least bit persuaded by the climate sceptics’ arguments despite the many hundreds of hours we have spent reading them. We note that after the website started its life on January 1, 2008, new global temperature records were set in 2010, 2014, 2015, and 2016, and that a new record for the Arctic sea ice area minimum was set in 2012 (and almost matched in 2016). These, however, are not the sorts of facts that will change minds!” Maybe I’ll add a climate change category in the future.

    → 9:32 PM, Feb 27
  • The Conversation Prism

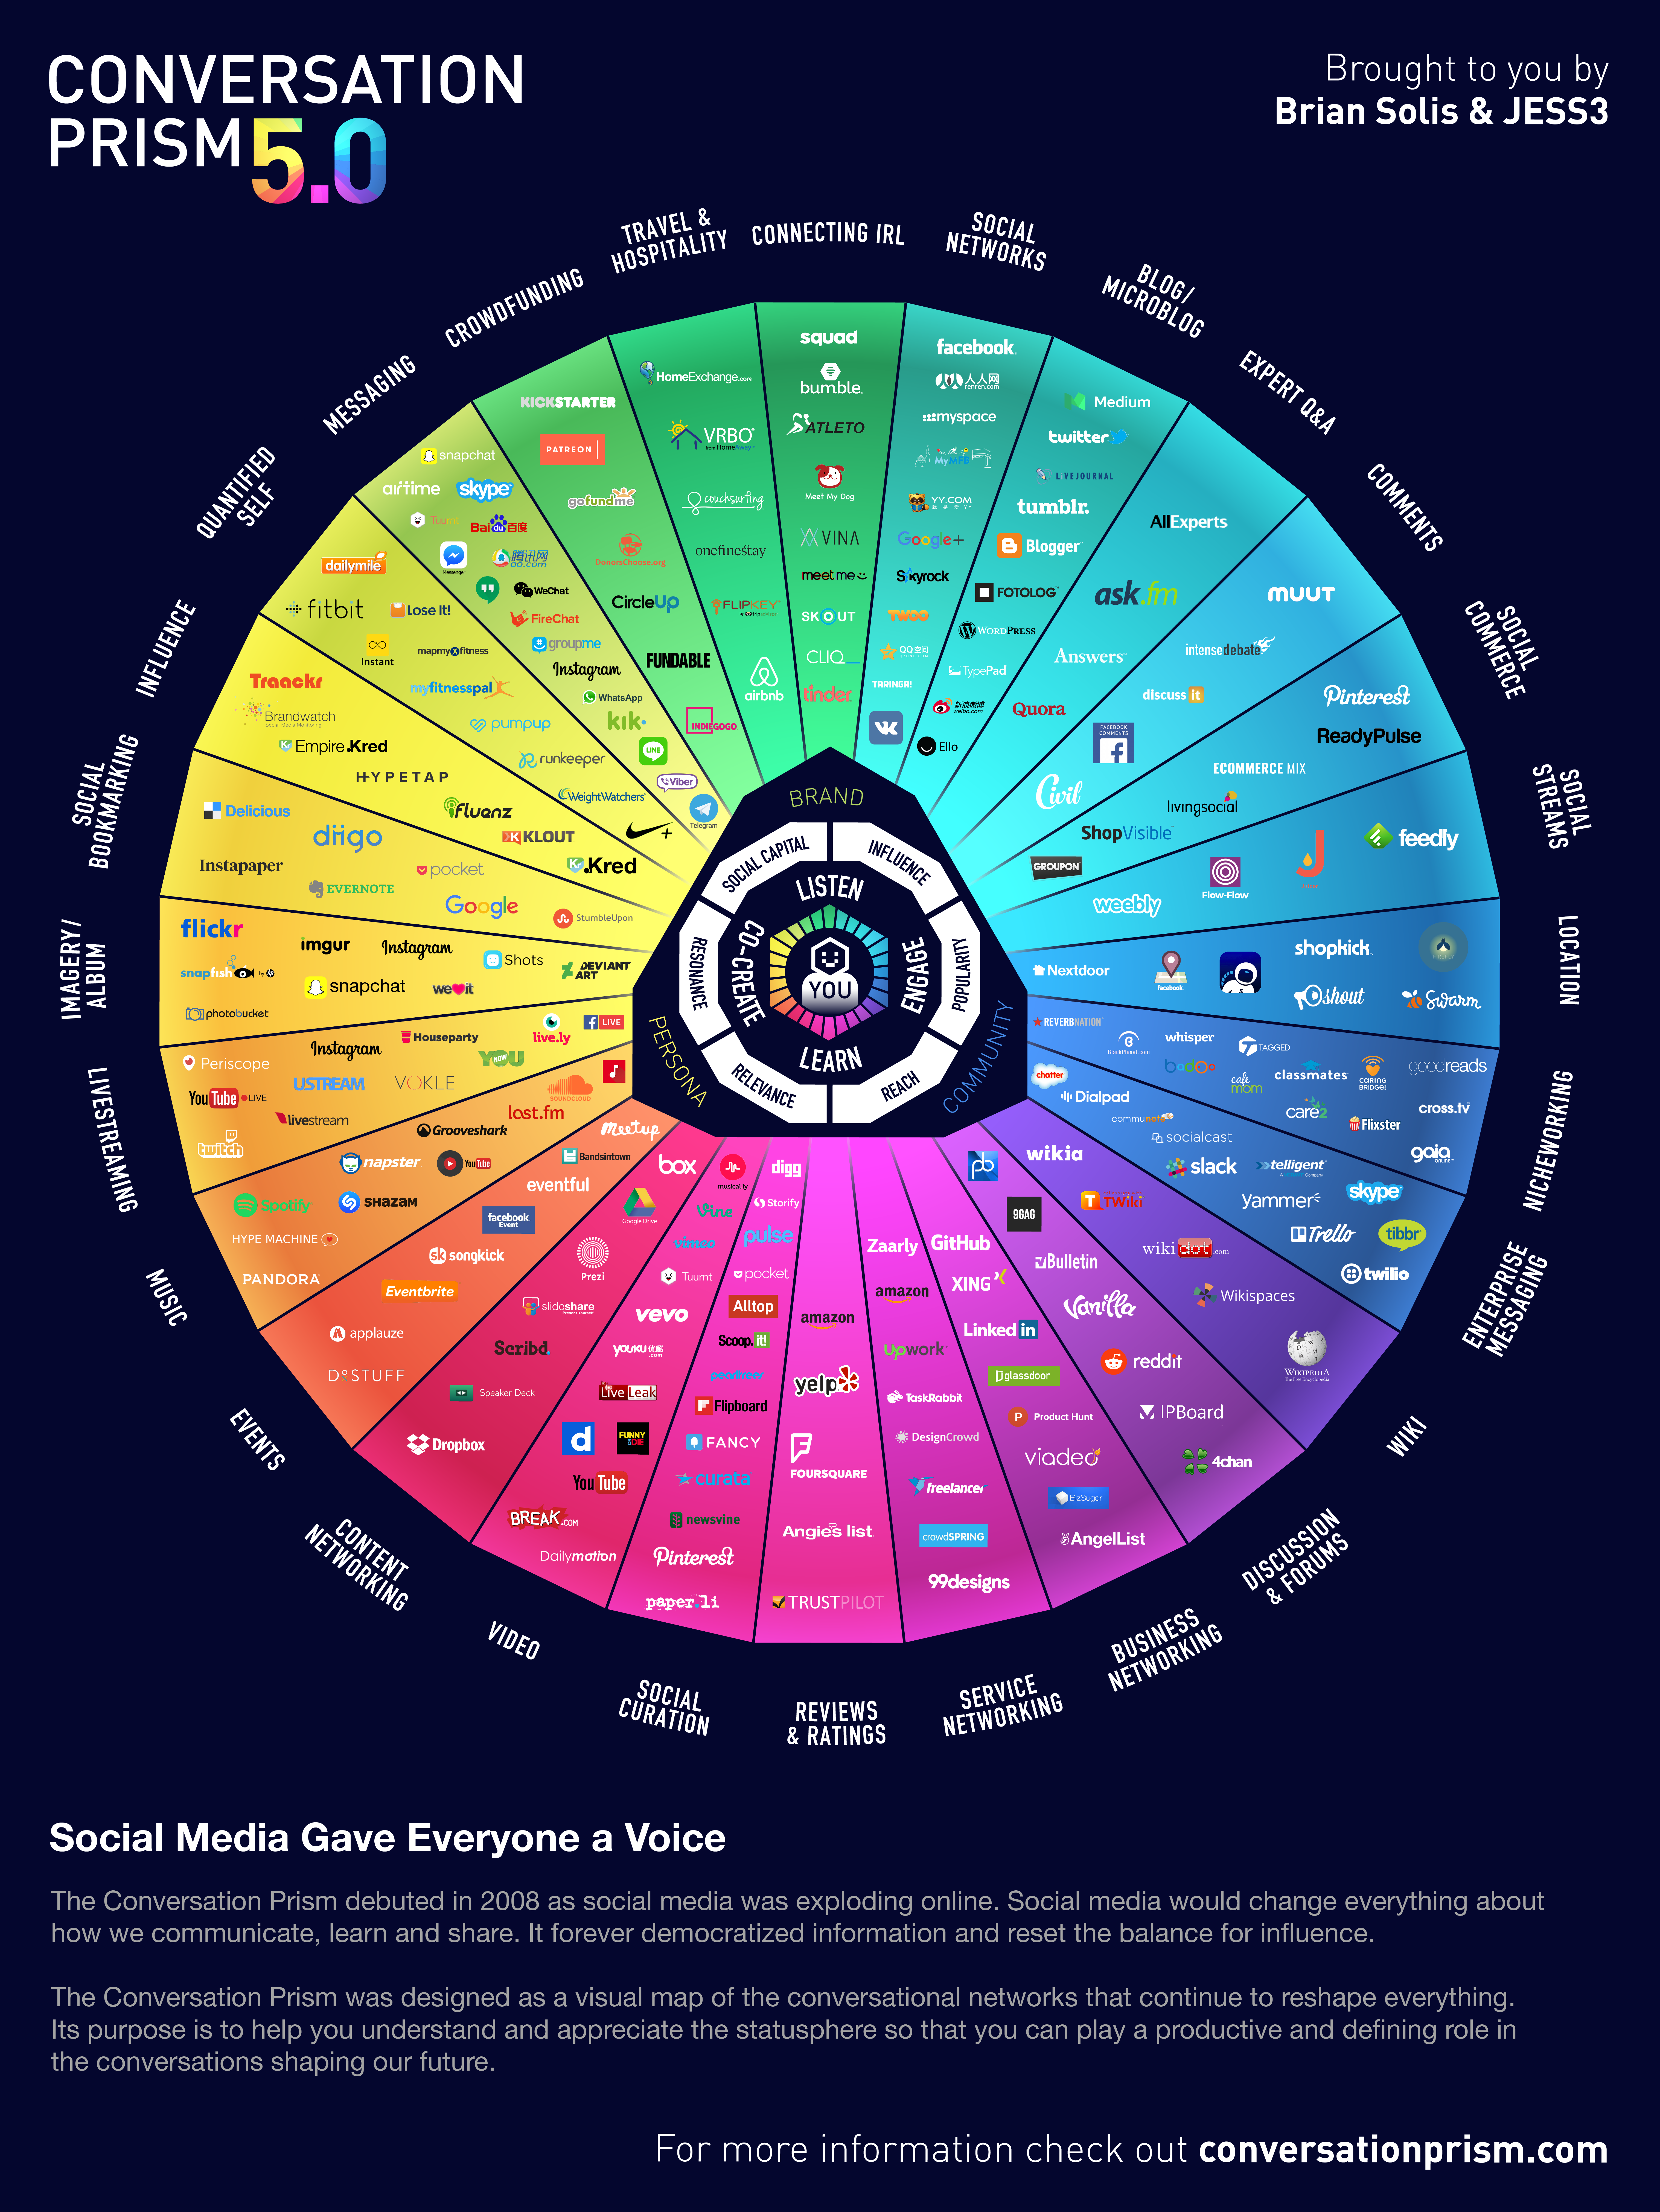
    The Conversation Prism 5.0 by Brian Solis and JESS3. Colorful. Dense. Social Media brands in the creators' taxonomy Less than a couple years old. (4.0 came out about 2013.) Do you think the color wheel is too much? I’m not seeing the descriptive categories mapping to it very well. Overall it does what an infographic should. It prompts me to think.

    Source: conversationprism.com

    → 10:11 PM, Feb 26
  • Sizing up space ships

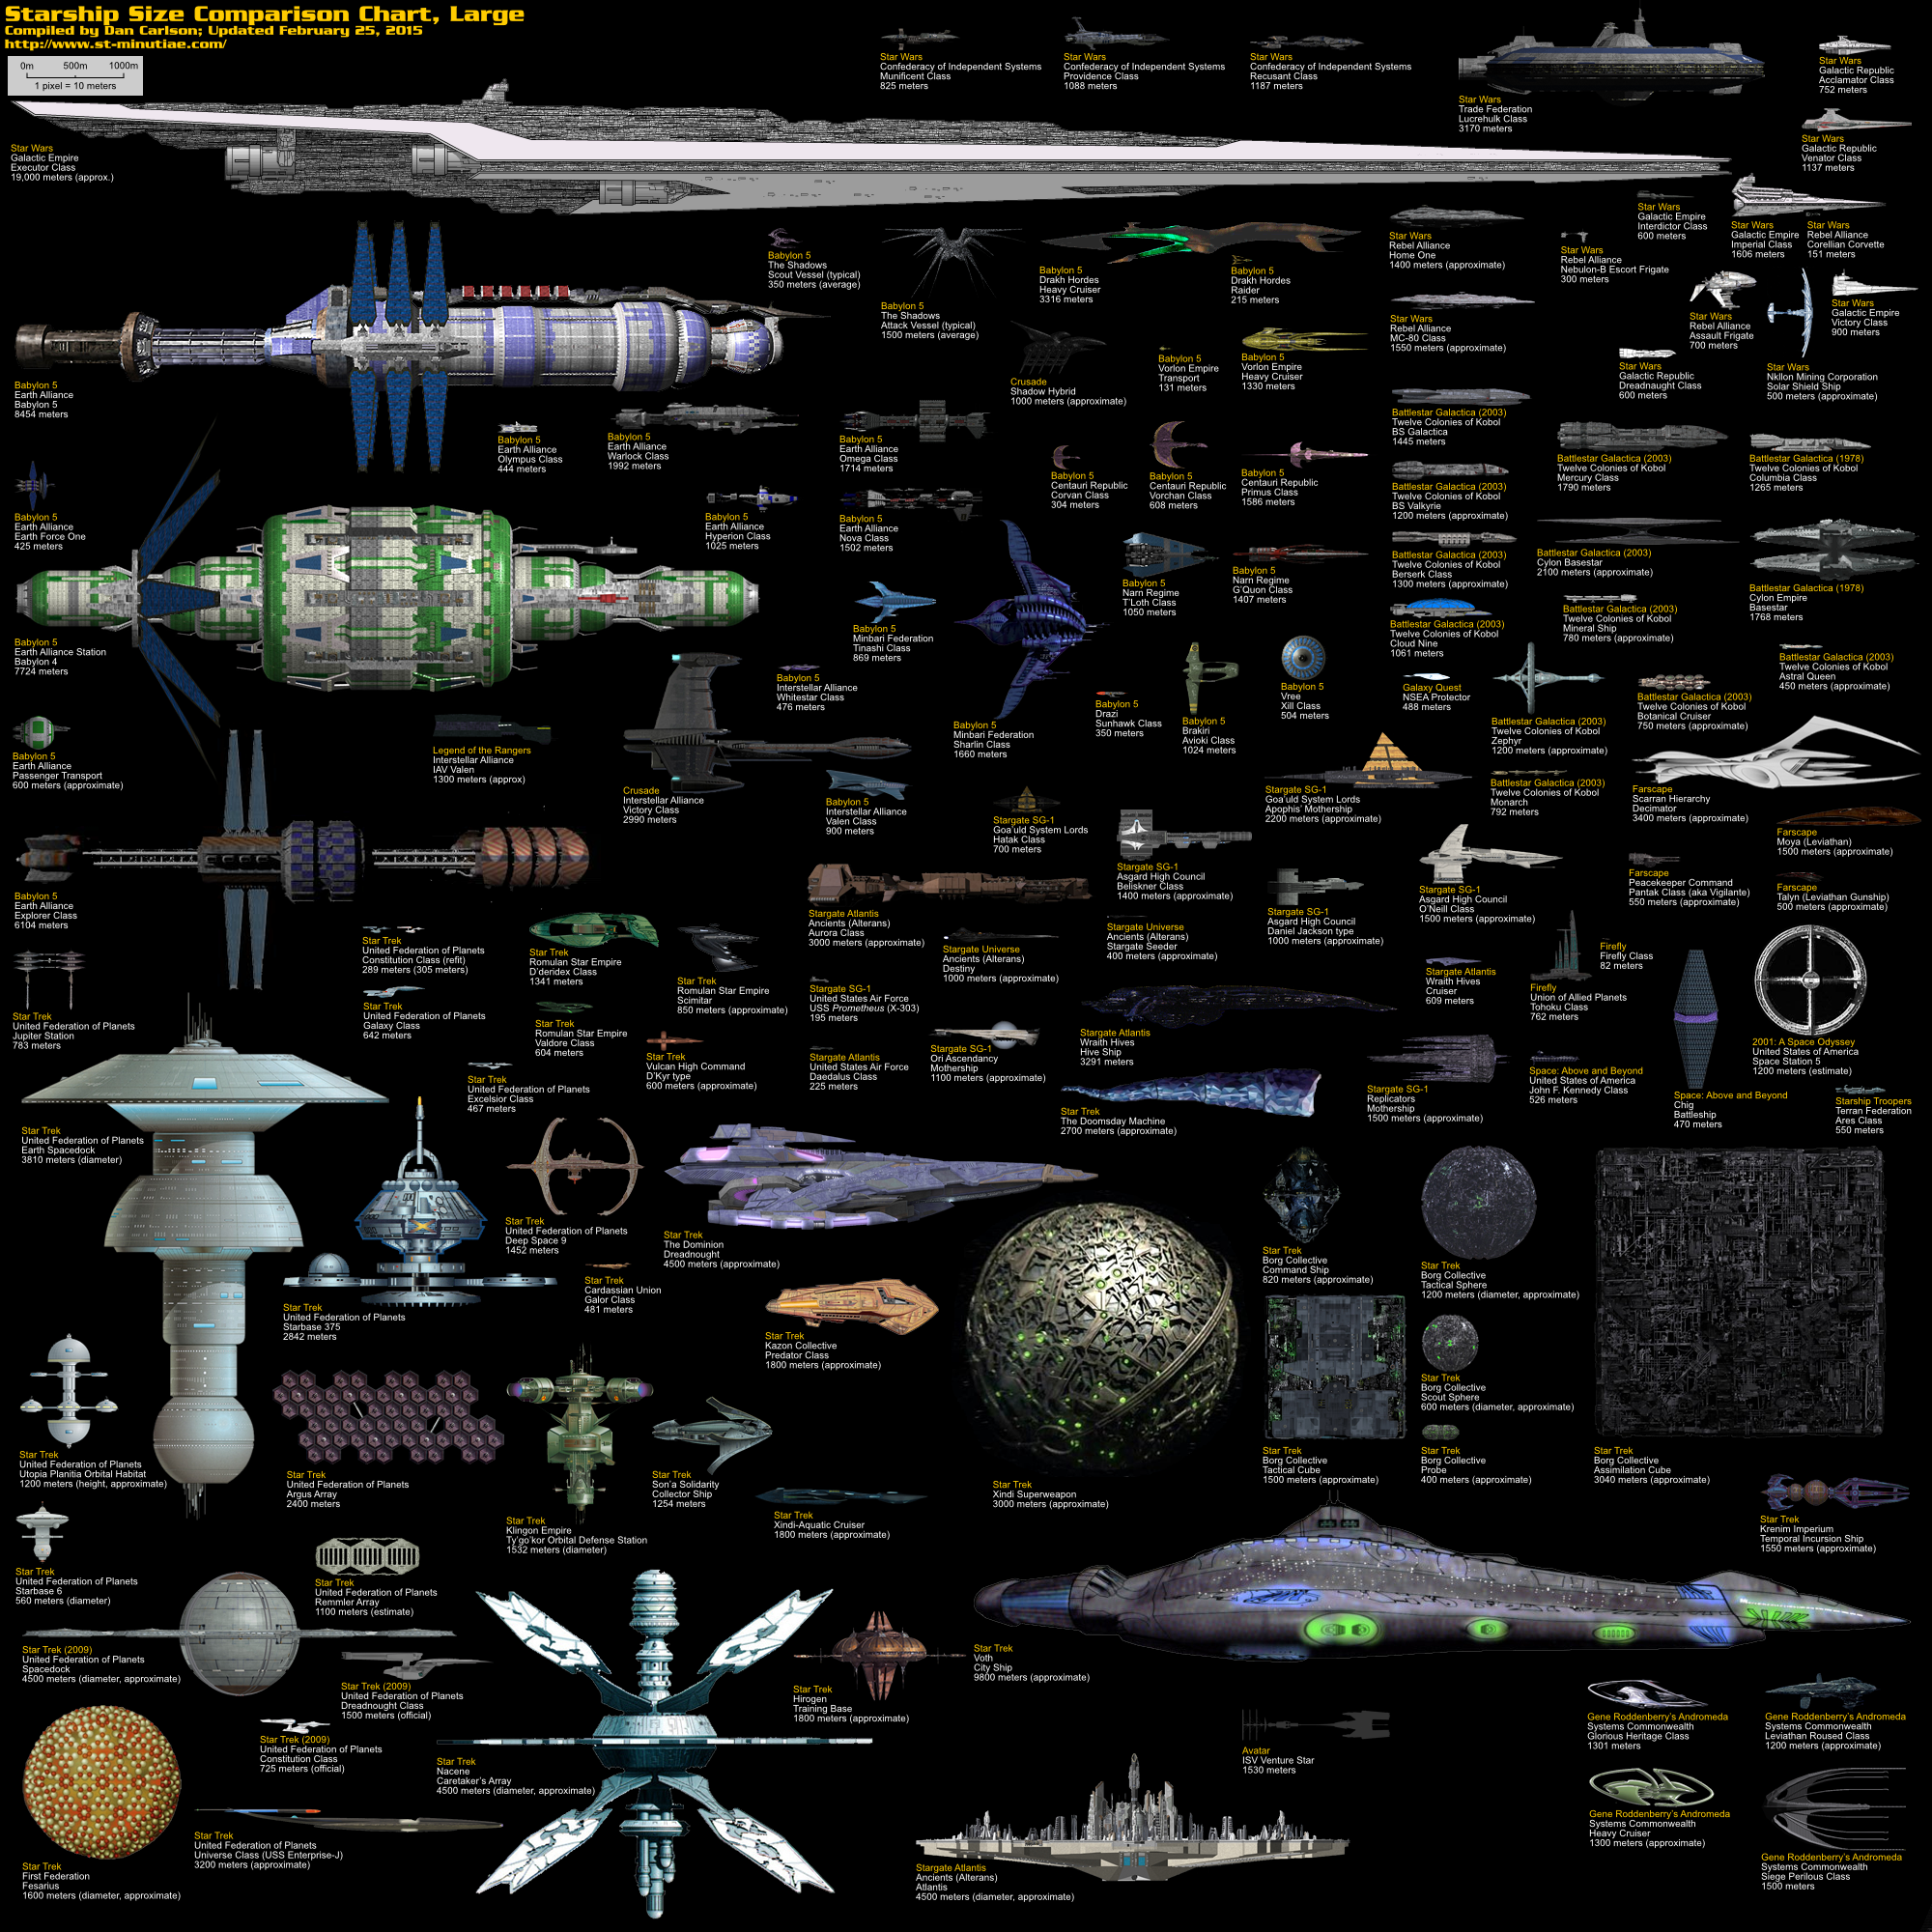
    Dan Carlson maintains a page comparing sizes of starships and other objects from many science fiction stories (small, medium, large, and huge): Starship Size Comparison. I like the large one best because it features the Star Trek Doomsday Machine. Visit his page to read his explanation about why he doesn’t compare anything to the Star Wars Death Stars.

    → 10:29 PM, Feb 25
  • I’m not feeling it tonight. Third check in the box for my Photo Challenge pin. My feelings don’t diminish this thought-provoking infographic, though. A Perspective on Time found at Visual.ly.

    → 12:26 AM, Feb 25
  • Infographic: American political parties between 1820 and 1860

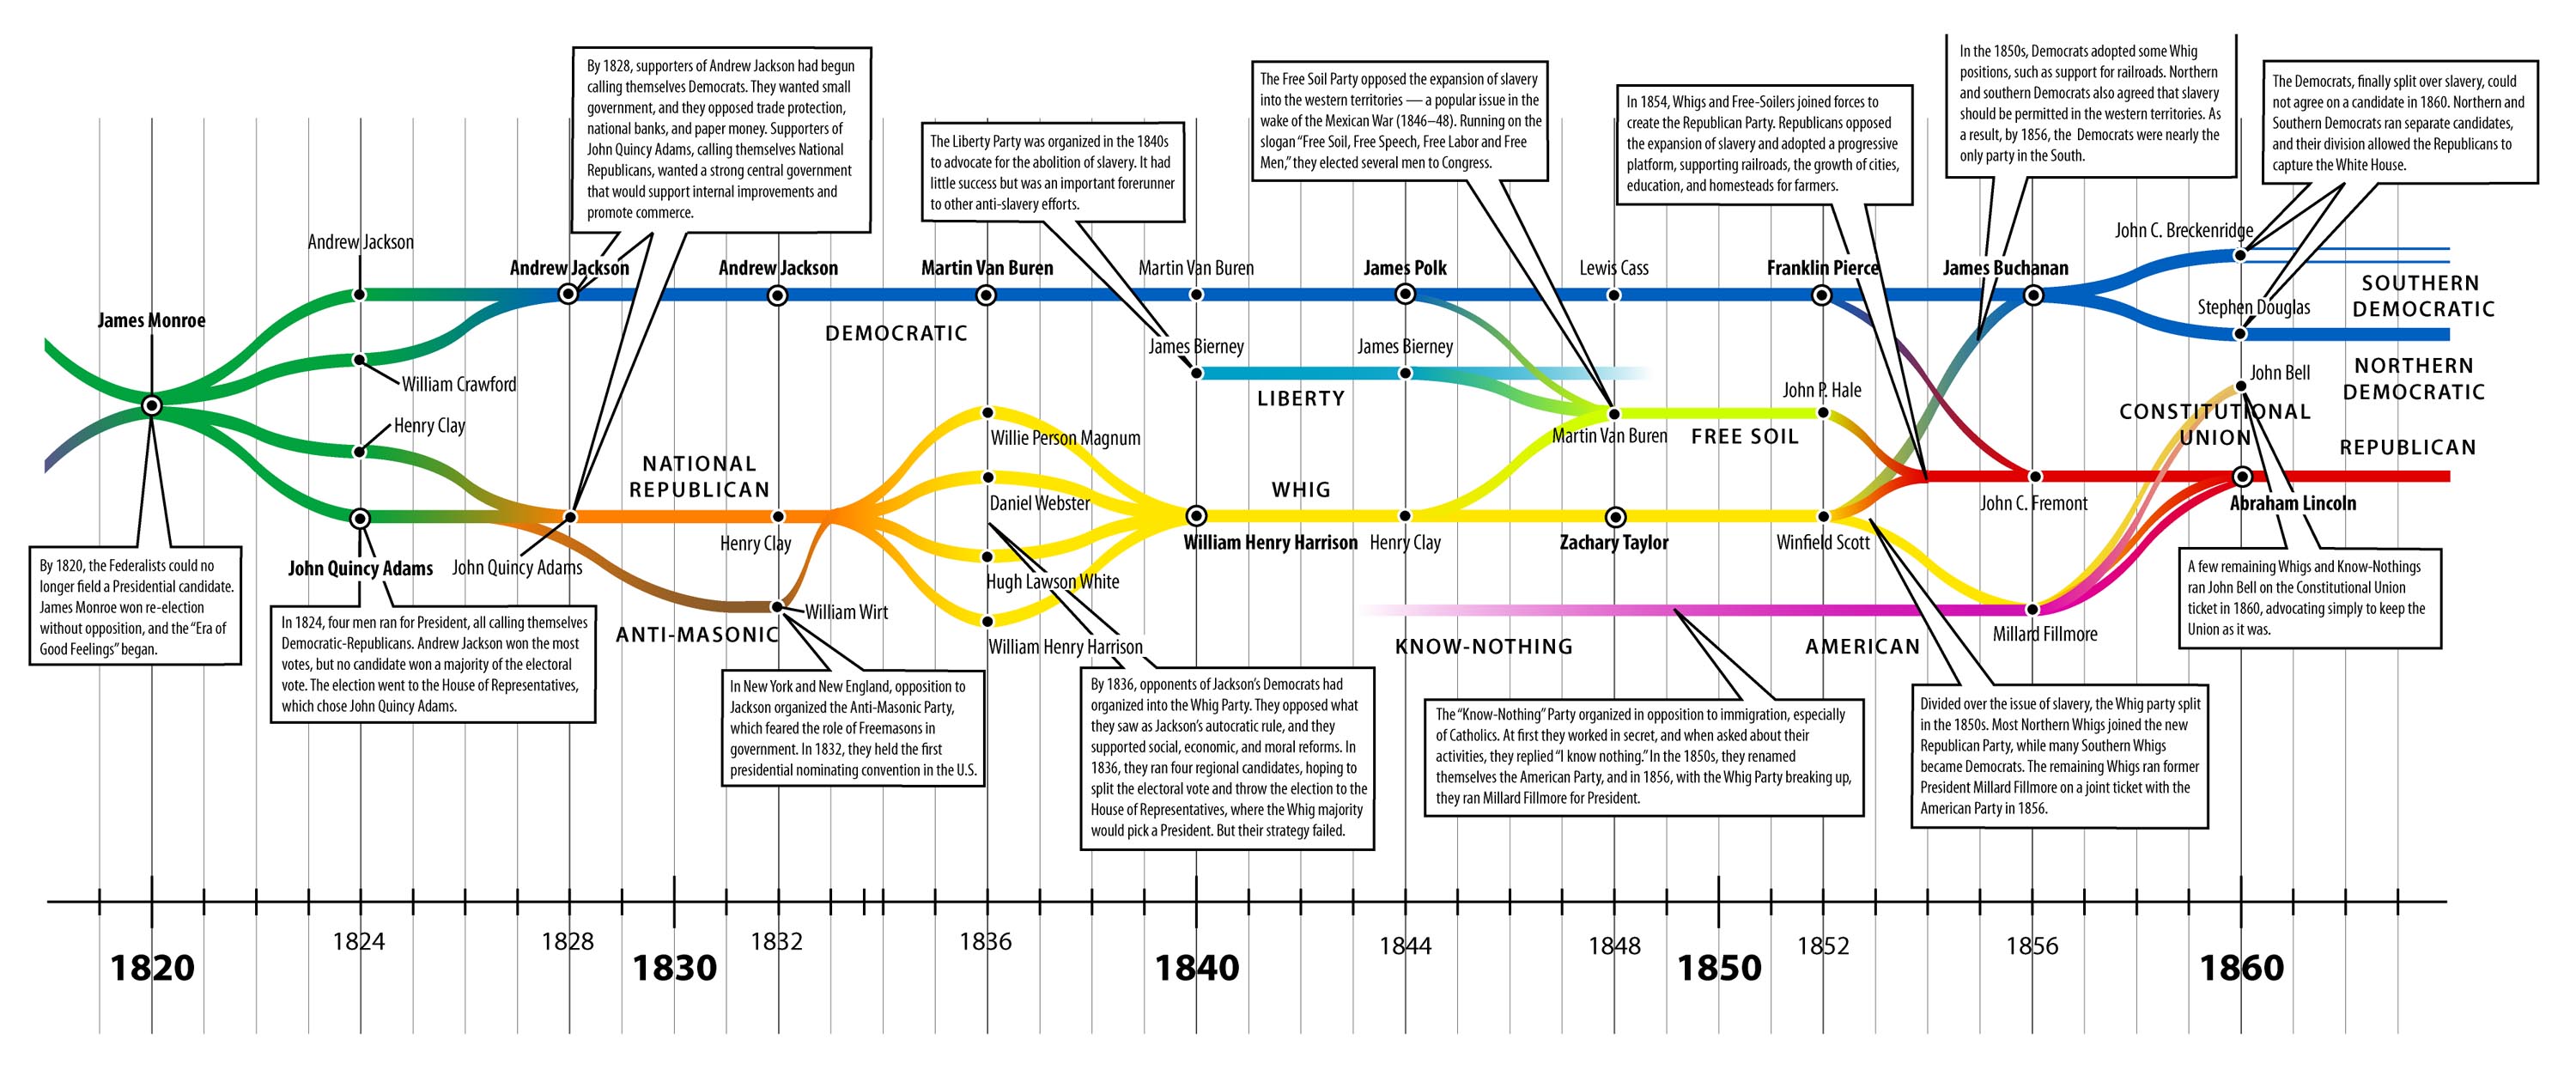
    This infographic shows American political parties between 1820 and 1860. Now I have to admit my poor record keeping. I don’t know its origin. However, Marty Duren blogged about it, and he says it came from learnnc.org. I can’t find the exact URL.

    → 9:50 PM, Feb 23
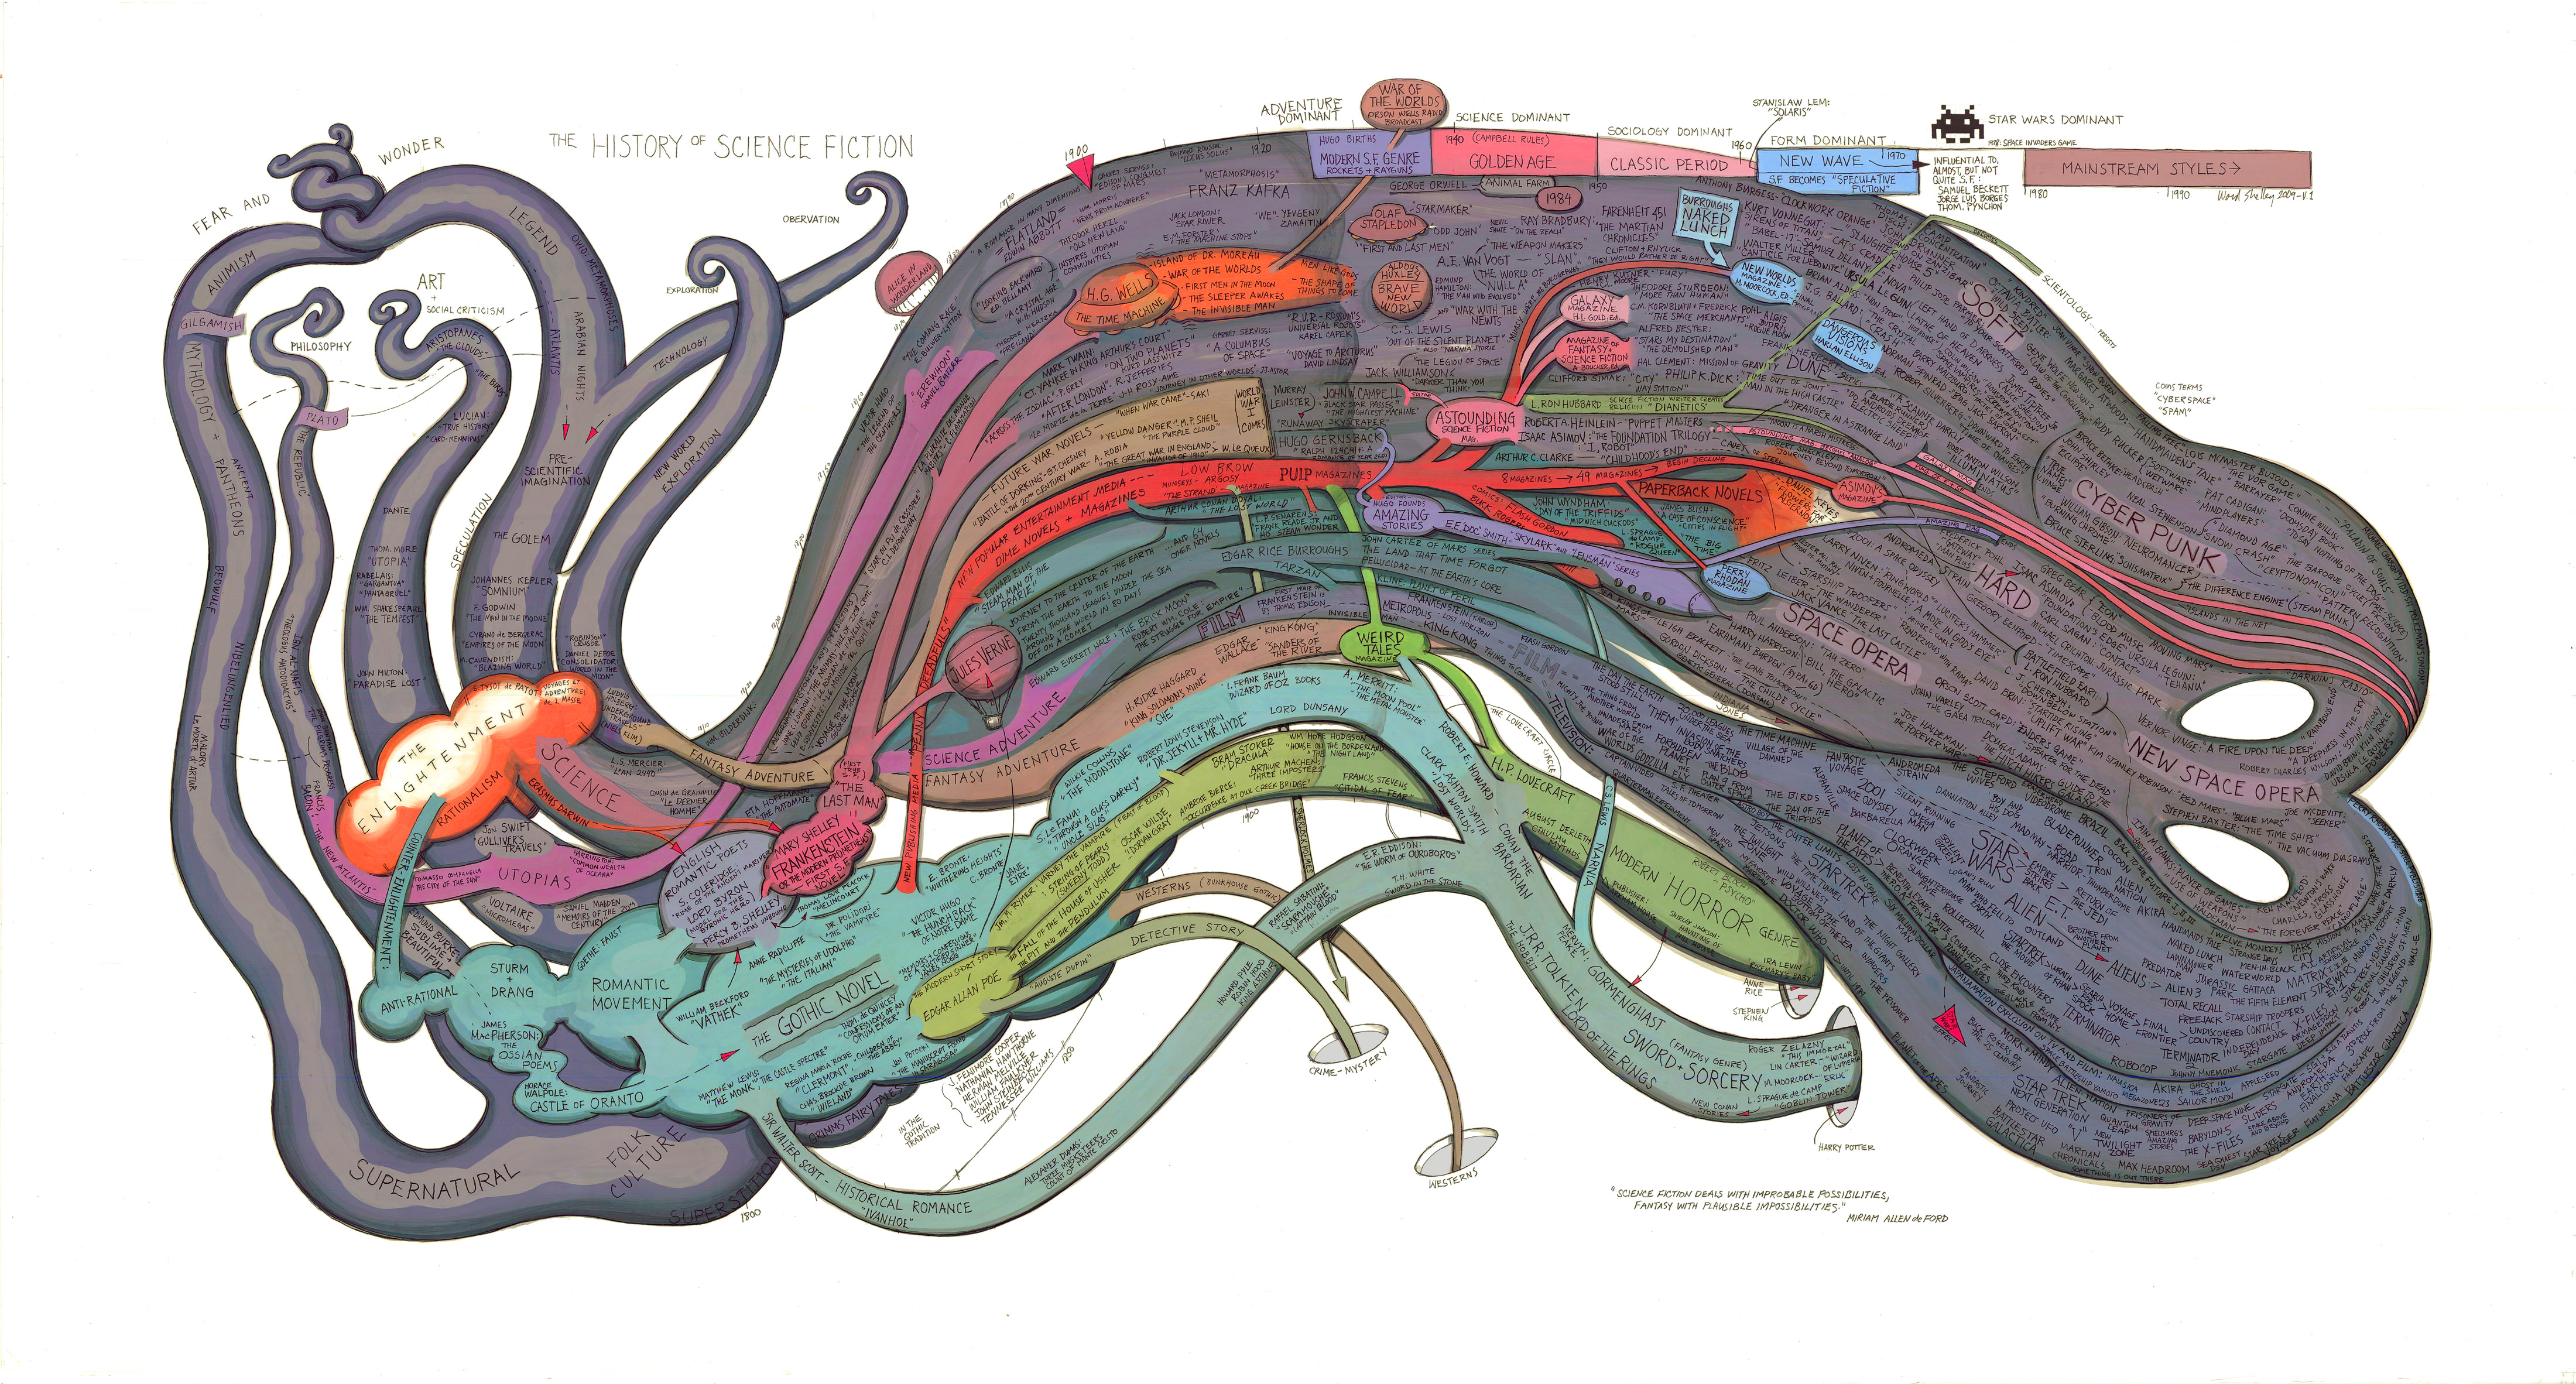
  • History of Science Fiction and a lot of meta content

    Rats! Didn’t even have a single streak after writing a flurry of posts on my first day here (g0220a). Starting over to earn my Photo Challenge and Daily Blogger pins.

    Here’s my second infographic. History of Science Fiction aka historyofsf. Source: Ward Shelley

    qqMeta: In this post I introduced two of my writing conventions. First, my 6-character tags, e.g. g0220a (meta-tag qqtags). This post is g0222c (tbcg0222c in internet namespace). I’ll talk about them in later posts. Second, my convention for citing sources is to redirect through Bitly and to ensure URLs are available at web.archive.org. I curate a list of all my Bitly URLs. If the service ended, or if I stopped agreeing to their terms, I would provide a lookup myself. (XKCD is an exception. I use live links and merely cite by reference number because XKCD is such a part of internet culture that I can’t imaging one ever not being able to find an XKCD comic as long as its number is cited.)

    Oh, and I guess qq is a third convention I just introduced. I’ll write more about that later, too. I do want to tip my hat to my friend d3matt. Years ago I discovered that he, too, has a habit of prefixing words with qq. Great minds think alike.

    I’ll also write at some point about the importance (IMHO) of unique symbols (case-insensitive) on the internet. I don’t have to call d3matt by his name. Too long. TBC is too common, so I claimed tbc0 as mine. The shorter the better. Even RMS and ESR don’t own their initials. Haha. And the CEO where I work is RTD, but I refer to him as qqRTD.
    → 1:52 PM, Feb 22
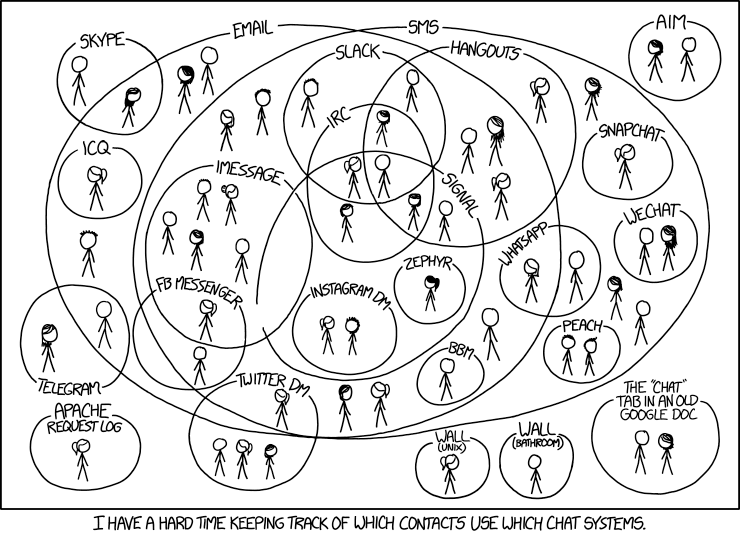
  • I want to earn my Photo Challenge pin. 7 days of “photos.” I hope the photos don’t have to be JPG. I love infographics. I have some cached. Here’s the first to kick things off. XKCD #1810. Chat Systems. And with this I will earn my Photoblog pin.

    → 7:35 PM, Feb 20
  • RSS
  • JSON Feed
  • Micro.blog